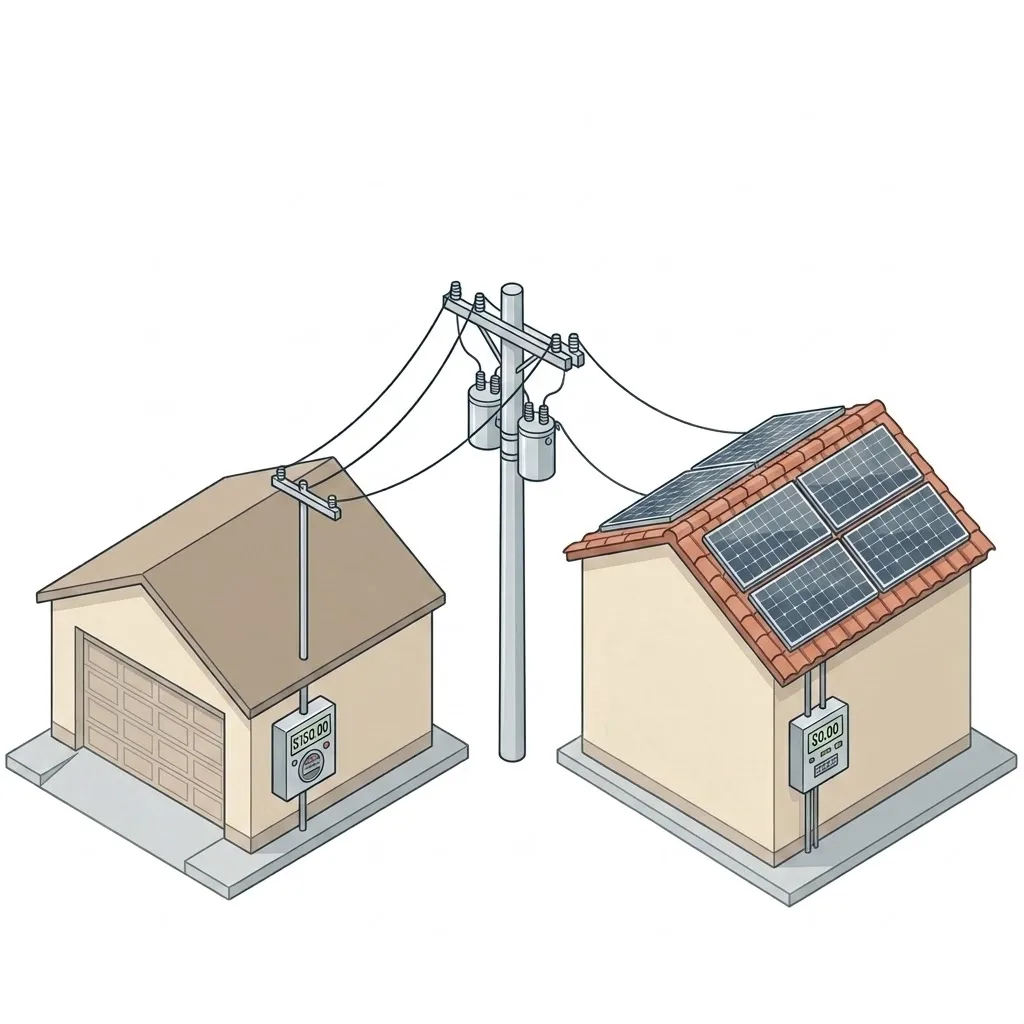
When a homeowner installs solar panels and their electricity bill drops to zero, someone still has to pay for the power lines, transformers, and substations that keep the grid running. Under traditional net metering policies, that someone was every other utility customer.
This is the cost-shifting debate that reshaped solar policy in California and is now driving net metering reform across the country. Here is what the evidence shows, where the debate stands, and what it means for homeowners considering solar.
How net metering creates the cost shift
Utility bills bundle several costs into one per-kilowatt-hour rate. The energy itself is only part of what you pay for. The rest covers fixed costs: transmission lines, distribution infrastructure, wildfire mitigation, public purpose programs, and grid maintenance. A typical California residential rate of 30 cents per kilowatt-hour includes roughly 8–10 cents of actual energy cost and 20+ cents of fixed infrastructure charges.
Under traditional net metering (NEM 1.0 in California), solar customers received credits at the full retail rate, the entire 30 cents, for every kilowatt-hour they exported to the grid. A system sized to offset 100% of consumption could produce a true-up bill near zero. The customer paid as little as a $1 per month connection fee.
The problem: when a solar customer's bill drops to near zero, they stop contributing to the fixed costs embedded in that per-kilowatt-hour rate. The utility still needs to recover those costs, so they get spread across fewer paying customers. Rates go up for everyone who does not have solar.
What the California data shows
California's experience is the most thoroughly documented case of net metering cost-shifting. The state has the highest rooftop solar penetration in the country, and its regulators have commissioned multiple studies quantifying the impact.
A 2021 evaluation commissioned by the California Public Utilities Commission found that after installing solar, NEM 2.0 customers collectively paid $618.6 million less than their utility's actual cost to serve them. Before solar, those same customers had paid $112.5 million more than their cost of service. The entire shortfall was absorbed by non-participating ratepayers.
The California Public Advocates Office, the independent ratepayer watchdog within the CPUC, estimated that by the end of 2024, non-solar customers were paying an estimated $8.5 billion annually in costs shifted from NEM participants. That figure more than doubled from $3.4 billion in 2021, driven partly by a rush of installations before NEM 2.0 expired.
For individual households, the impact is measurable. Low-income non-solar customers pay an estimated $67–$128 more per year depending on their utility. Non-low-income non-solar households pay $100–$234 more. The CPUC estimates the NEM subsidy accounts for roughly 21–27% of a non-solar customer's electricity bill.
UC Berkeley energy economist Severin Borenstein quantified the per-kilowatt-hour gap: in 2019, PG&E solar customers received credits of more than 26 cents per kilowatt-hour for exported energy, while the utility's actual avoided cost was only about 8 cents. The 18-cent difference per kilowatt-hour represents fixed grid costs that non-solar customers absorbed.
The national picture is different
California's cost-shift numbers are dramatic because the state has exceptionally high solar penetration. Nationally, the picture is more nuanced.
Lawrence Berkeley National Laboratory found that at the U.S. average solar penetration of roughly 0.4% of retail sales, distributed solar raises average electricity rates by no more than $0.0003 per kilowatt-hour, effectively negligible. Even at 10% penetration, the impact ranges from a 5% decrease to a 5% increase in retail prices.
A 2025 National Renewable Energy Laboratory study found that the cost impact was less than $1 per month per non-solar customer in 38 of 44 states that have offered net metering. NREL deliberately chose not to call these impacts "cost shifts" because revenue under-recovery may or may not ultimately translate to rate increases, depending on how regulators respond.
The Brookings Institution reviewed 11 independent state studies and found that in 8 of them, the value solar provided to the grid, including avoided transmission investment, reduced peak demand, and environmental benefits, exceeded the retail rate at which solar customers were compensated. States like Vermont, Minnesota, and Maine found net benefits from their net metering programs when all grid services were accounted for.
A DOE-commissioned meta-analysis of 15 state studies concluded there is no consensus: studies using utility-centric avoided-cost methods tend to show cost shifts, while studies using broader societal value frameworks tend to show net benefits.
The duck curve and midday oversupply
Part of what makes the cost-shift problem worse in California is the duck curve. As solar capacity has grown, the state regularly produces more electricity than it needs during midday hours.
U.S. Energy Information Administration data shows that California's midday dip in net load, total demand minus solar generation, has deepened significantly as solar capacity expanded. On spring days, solar generation can exceed 100% of demand, forcing the state to curtail generation or export power to neighboring states at negative prices.
This oversupply means that a kilowatt-hour of solar exported at noon has very low grid value. The grid does not need it, and may actually pay to get rid of it. Yet under NEM 1.0 and NEM 2.0, that noon export was credited at the same full retail rate as a kilowatt-hour consumed during the evening peak, when the grid needs power most.
NEM 3.0: the regulatory response
California's response to the documented cost shift was NEM 3.0, formally called the Net Billing Tariff, adopted by the CPUC in December 2022 and effective for new interconnection applications starting April 2023.
The core change: export credits dropped from the retail rate (roughly 30 cents per kilowatt-hour) to avoided-cost rates averaging about 8 cents per kilowatt-hour, approximately a 75% reduction. The tariff uses 576 distinct hourly and seasonal rate combinations, so export value varies by time of day. Midday exports during oversupply periods can earn as little as 2 cents per kilowatt-hour, while evening exports during peak demand earn significantly more.
The design explicitly incentivizes self-consumption and battery storage rather than grid export. Solar customers who store midday production in a battery and use it during the evening peak capture the full retail rate for that energy, effectively three to four times the value of exporting it.
The impact on the solar industry was immediate. Residential solar installations dropped sharply, several installers reported sales near zero, and the industry shed roughly 17,000 jobs in California. Battery attachment rates, however, rose from about 10% under NEM 2.0 to above 60% under NEM 3.0, as solar-plus-storage became the economically rational choice.
The equity dimension
The cost-shifting debate has a significant equity component. Solar adoption in the United States skews heavily toward higher-income households. Lawrence Berkeley National Lab data cited by Borenstein shows the median income of 2019 California solar adopters was approximately $120,000, compared to a state median of about $78,000.
The National Academies of Sciences found that only about 3% of solar adopters earned less than 120% of their area's median income as of 2021, and that net metering participants are disproportionately affluent, well-educated, and White.
Low-income households spend an average of 8.1% of income on energy, compared to 2.3% for higher-income households. When NEM cost shifts raise electricity rates, the burden falls hardest on those who can least afford it and who are least able to install their own solar, including renters, apartment dwellers, and households without suitable roof space.
This dynamic is why some environmental justice organizations supported NEM reform even as they supported solar expansion generally. The California Public Advocates Office framed the issue directly: low-income households and renters who cannot install solar should not be required to subsidize the electricity bills of higher-income homeowners who can.
Other states are following
California is not alone. By 2024, the NC Clean Energy Technology Center reported that 47 states plus DC and Puerto Rico had taken distributed solar policy actions, with net metering changes being the most common.
Hawaii ended traditional net metering in 2015 after finding that 88% of ratepayers were subsidizing the 12% with solar. Nevada restructured its NEM rates in 2015, though the legislature partially reversed the changes in 2017. Arizona ended retail net metering in 2016. States including West Virginia, Virginia, New Jersey, and Maryland are all moving toward time-differentiated export compensation that pays less than full retail.
The broad trend is away from 1:1 retail-rate crediting and toward avoided-cost or wholesale-rate compensation for grid exports, often with time-of-use differentiation that pays more during peak demand hours.
What this means for homeowners
If you are considering solar today, the economics depend heavily on your state's current net metering policy and where it is headed.
In states still offering full retail net metering: The economics of solar-only systems remain strong, but policies are likely to change. Systems installed now may be grandfathered under current rules for a fixed period, typically 15–20 years.
In states that have moved to net billing or reduced export credits: Solar-plus-battery systems are the better investment. A battery lets you store midday production and use it during expensive evening hours, capturing the full retail rate instead of a reduced export credit.
Regardless of your state: Self-consumption, using your solar production directly rather than exporting it, always provides the most value. Running high-draw appliances during peak solar hours, charging an electric vehicle during the day, and pre-cooling your home in the afternoon all reduce the amount of energy you need to export.
The cost-shifting debate does not change the fundamental value proposition of solar for the homeowner who installs it. What it changes is how the system should be sized and whether a battery makes economic sense; and increasingly, the answer is yes.